
Dashboard
The Dashboard is the landing screen you see right after Anmelden. Everything on it is a single backend call — health, counters, activity, drafts, and failed logins are loaded together, so the screen is always one snapshot in time.
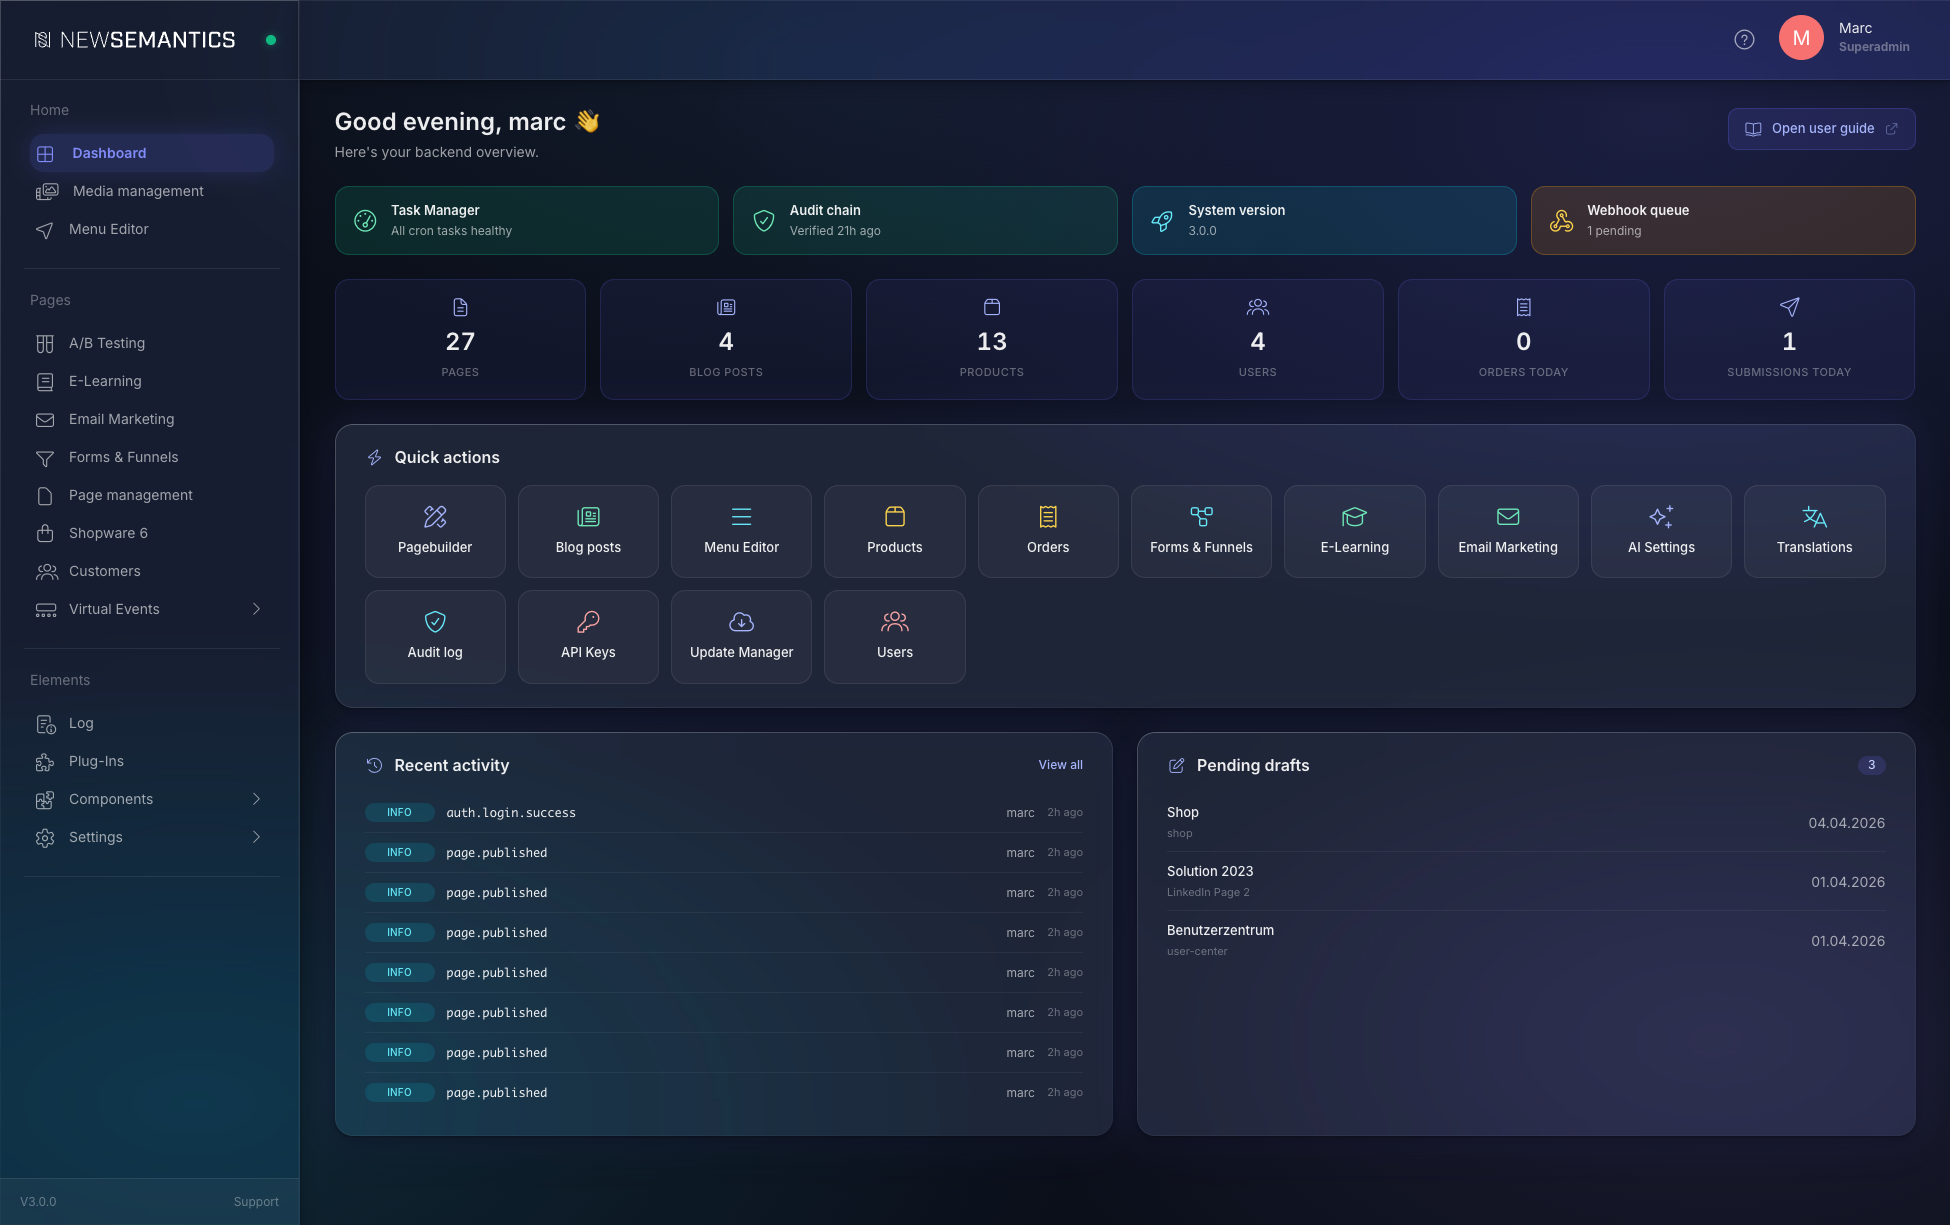
What you see at a glance
The Dashboard has six sections, top to bottom:
- Greeting — your name, time-of-day greeting, and a link to the User Guide.
- System health — four pills: Task Manager, Audit chain, System version, Webhook queue.
- Counters — six headline numbers for content + activity today.
- Quick Actions — a grid of shortcuts. Only modules whose plugin is installed and whose permission you hold are shown.
- Recent Activity + Pending Drafts — two columns side by side.
- Recent failed logins — only rendered when at least one failed login exists in the audit log.
Greeting
Time-aware greeting + your username. The greeting switches between Good morning (before 11), Hello (11–17), Good evening (18–4), and Good night (after 5). The link Open user guide opens this guide in a new tab.
System health pills
Four pills, color-coded green / amber / red. Each pill is read-only — click the relevant module (sidebar or Quick Action) to drill down.
| Pill | Green | Amber | Red |
|---|---|---|---|
| Task Manager | All cron tasks healthy | A scheduled task with interval < 2h has not run for over 2 hours | — |
| Audit chain | Verified N hours ago | Never verified yet | Broken at id N |
| System version | Always informational, shows the running CMS version | — | — |
| Webhook queue | All delivered | N pending | N failed |
Audit chain verification
The chain is re-verified by a daily scheduled task. If you just installed the CMS or never ran the verifier, the pill stays amber until the first run. See Audit log for how the chain works.
Broken audit chain
A red Audit-chain pill means a row in the log table was modified after it was written. Treat this as an integrity incident — open the Audit log and follow the recovery flow there. Do not ignore it.
Counters
Six headline numbers calculated on every Dashboard load.
| Counter | What it counts |
|---|---|
| Pages | Rows in pages_custom (across languages, but each page counted once via base_id = id). |
| Blog posts | Rows in blog (one per post, base-language only). |
| Products | Rows in s_products (base-language only). |
| Users | Active frontend users (s_users.active = 1). |
| Orders today | Native-shop orders with DATE(timestamp) = CURDATE(). |
| Submissions today | Form-funnel submissions started today. |
Counters are recomputed on every Dashboard visit — there is no cache. Refresh the page to update.
Quick Actions
A grid of one-click shortcuts to the most-used modules. The list is plugin-aware and permission-aware:
- Shortcuts to a module are hidden if the module's plugin is not installed.
- Shortcuts are also hidden if your user group does not have the corresponding permission.
- Superadmins (
rights = *) see every installed shortcut.
Clicking a shortcut navigates inside the SPA — the page does not reload.
The current shortcut set covers Pagebuilder, Blog posts, Menu Editor, Products, Orders, Forms & Funnels, E-Learning, Email Marketing, AI Settings, Translations, Audit log, API Keys, Update Manager, and Users.
Why a shortcut is missing
If you expect to see a shortcut that isn't there, the most likely cause is a missing permission on your user group. Check Settings → User groups or ask a Superadmin.
Recent Activity
The eight newest entries from the audit log. Each row carries a severity badge (Info / Warning / Critical), the event type (e.g. page.published, item.blog.deleted, auth.login.failed), the username (when known), and a relative timestamp. The link View all opens the full Audit log.
Severity levels follow the audit catalog:
- Info — read-only or routine state changes (login success, page published).
- Warning — destructive or security-sensitive (item deleted, failed login, API key rotation).
- Critical — system-impacting events (deployment triggered, migrations executed).
Pending Drafts
Pages with has_draft = 1, ordered by the most recent edit (taken from page_versions.created_at). Up to six entries. Click an entry to jump straight into the page details. The badge in the section header shows the total count.
When Pending Drafts is empty, you see a green checkmark — that means every page on the site is currently published.
Recent failed logins
This section only appears when there is at least one entry of type auth.login.failed in the audit log. Each row shows the source IP, the username that was attempted (when present), and a relative timestamp. The link Investigate opens the Audit log filtered to authentication events.
Repeated failures from one IP
After 15 consecutive failed attempts from the same IP, the auth handler emits an additional auth.account_locked event with severity Warning. If you see clusters of failures, check the Audit log for matching account_locked entries and consider rate-limiting at the firewall or CDN.
Dark mode
Every Dashboard surface adapts to dark mode. Toggle it from the top-bar user menu (Light Mode ⇄ Dark Mode); the choice is stored in the ns_darkmode cookie for one year.
See also
- Backend Tour — five-minute orientation across the whole Backend.
- Key Concepts — the mental model behind pages, drafts, and modules.
- Audit log — full event history, severity rules, and chain verification.
- Task Manager — what powers the Task-Manager pill.
- Webhooks — what powers the Webhook-queue pill.